For the complete documentation index, see llms.txt. This page is also available as Markdown.

View Training Results

Training graphs and insights are made available for all Roboflow Train jobs.

About

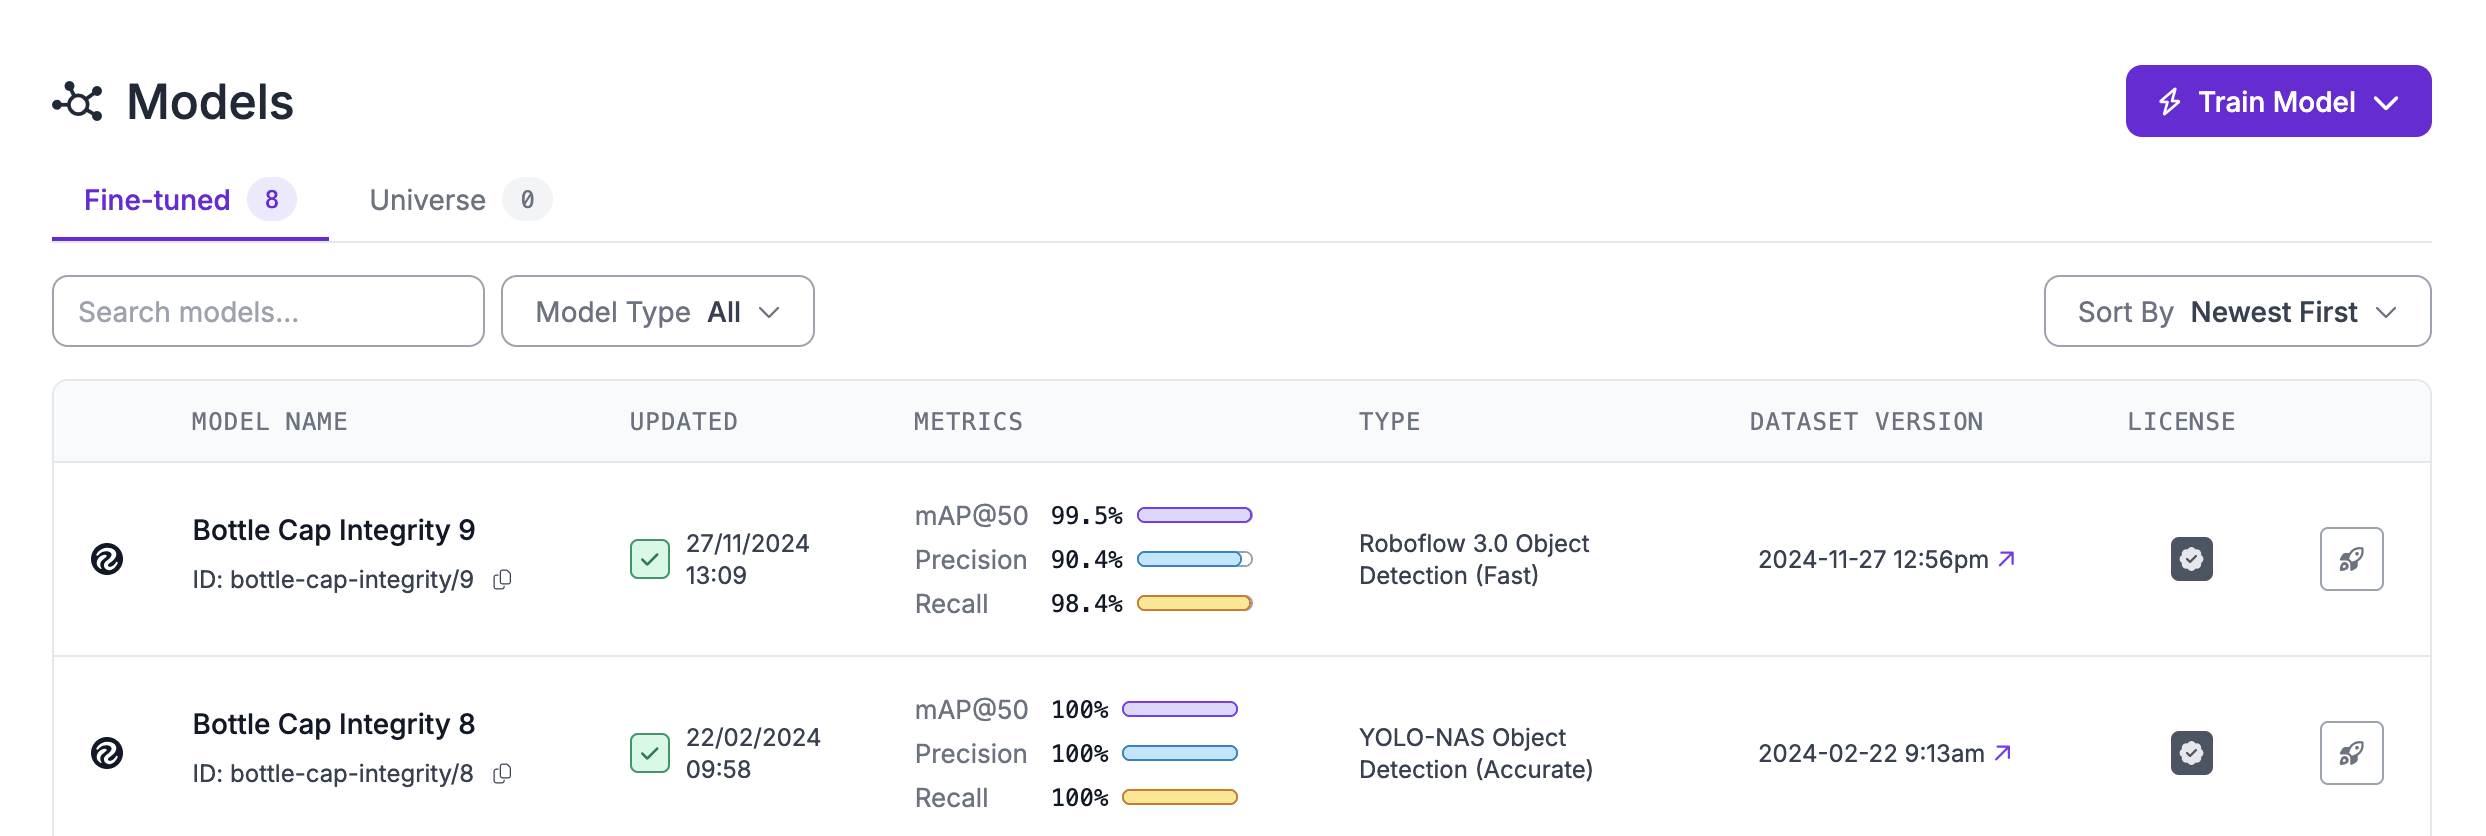
Roboflow produces training graphs and summary metrics for every model you train on the platform, letting you monitor a job while it runs and evaluate the resulting model once it finishes. The metrics shown depend on your project type - precision, recall, and mAP for object detection; accuracy for classification; mAP for segmentation and keypoint models; and perplexity for multimodal models. You can also test a finished model on sample or custom images before wiring it into an application.

Training graphs let you see the status of your model during training. Training graphs are available for all models trained on Roboflow.

You will also see metrics that summarise your model performance.

The metrics you will see will depend on your model type:

  • Object detection projects show the precision, recall, and mAP of the model.

  • Classification projects show accuracy.

  • Segmentation and keypoint models show mAP score.

  • Multimodal models show perplexity.

During Training

After you start training a model, a message will appear on the dataset version page associated with the model you are training. This message will first say that a training machine is starting.

If a version has more than one training, select a training on the version page to view its graphs and metrics.

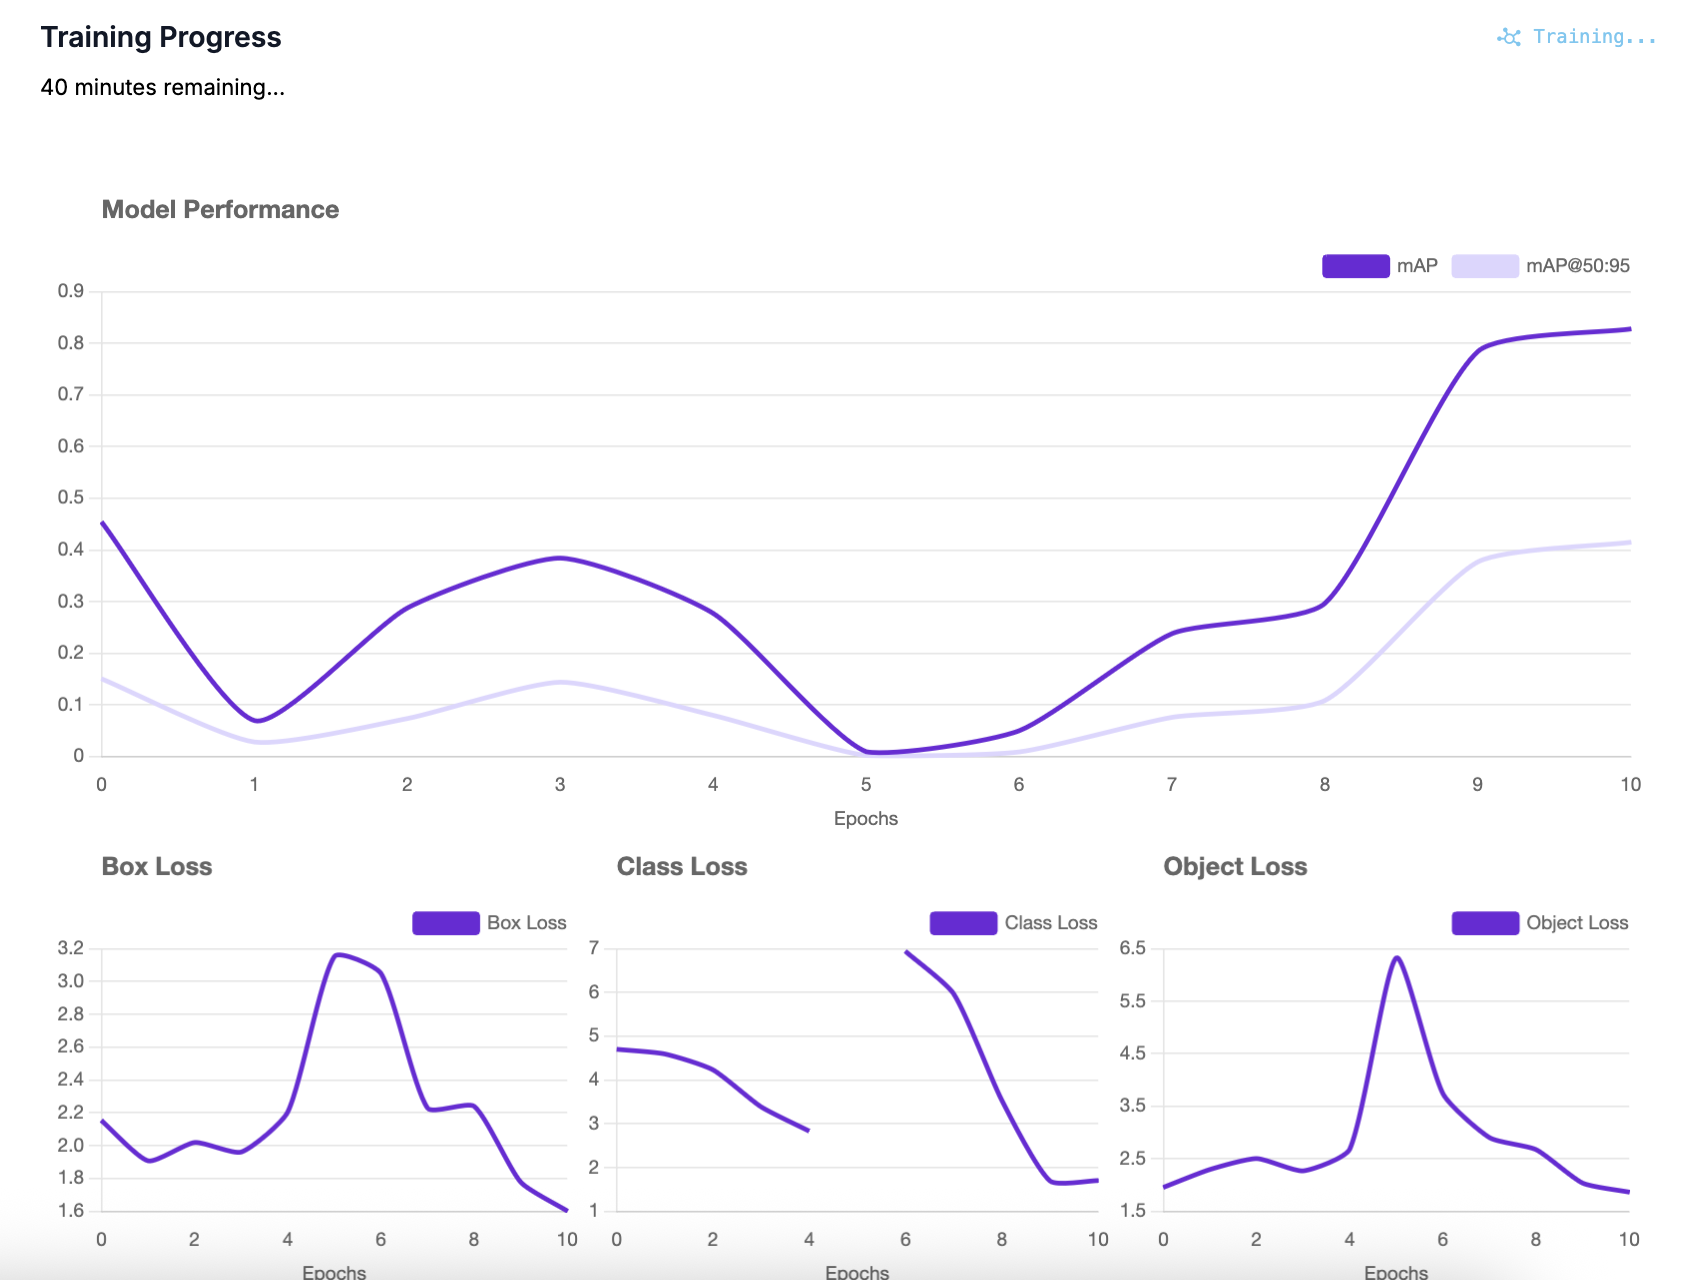
You will then see training graphs appear live as your model trains:

Training graphs as a model trains.

NAS Training Charts

For models trained with Neural Architecture Search (NAS) on object detection or instance segmentation projects, a specialized paired chart view is displayed instead of standard training graphs:

  • Training Progress Band: A gradient-filled band showing the range of model performance (upper and lower bounds) over training epochs. Hover over any epoch to inspect metrics at that point. A pulsing indicator shows the current training front during live training.

  • Epoch Snapshot: A Pareto curve showing the trade-off between model latency and accuracy for the architectures evaluated at each epoch. The gradient spectrum ranges from faster (lighter) to more accurate (darker) models.

Unlike Standard and Plus NAS runs, Fast NAS runs have no baseline configurations to report a spread of metrics for during training, so they report metrics only for the single supernet being trained. These runs show the standard training graph instead of the paired band and snapshot view.

After Training

When your model has finished training, you can view metrics from the training process.

To find your training graphs for a model after training, first click the Models tab in the sidebar:

Then, click on the training (or model) whose training graphs you want to see.

Scroll down on the page until you see the Training Graphs section:

Test Your Model

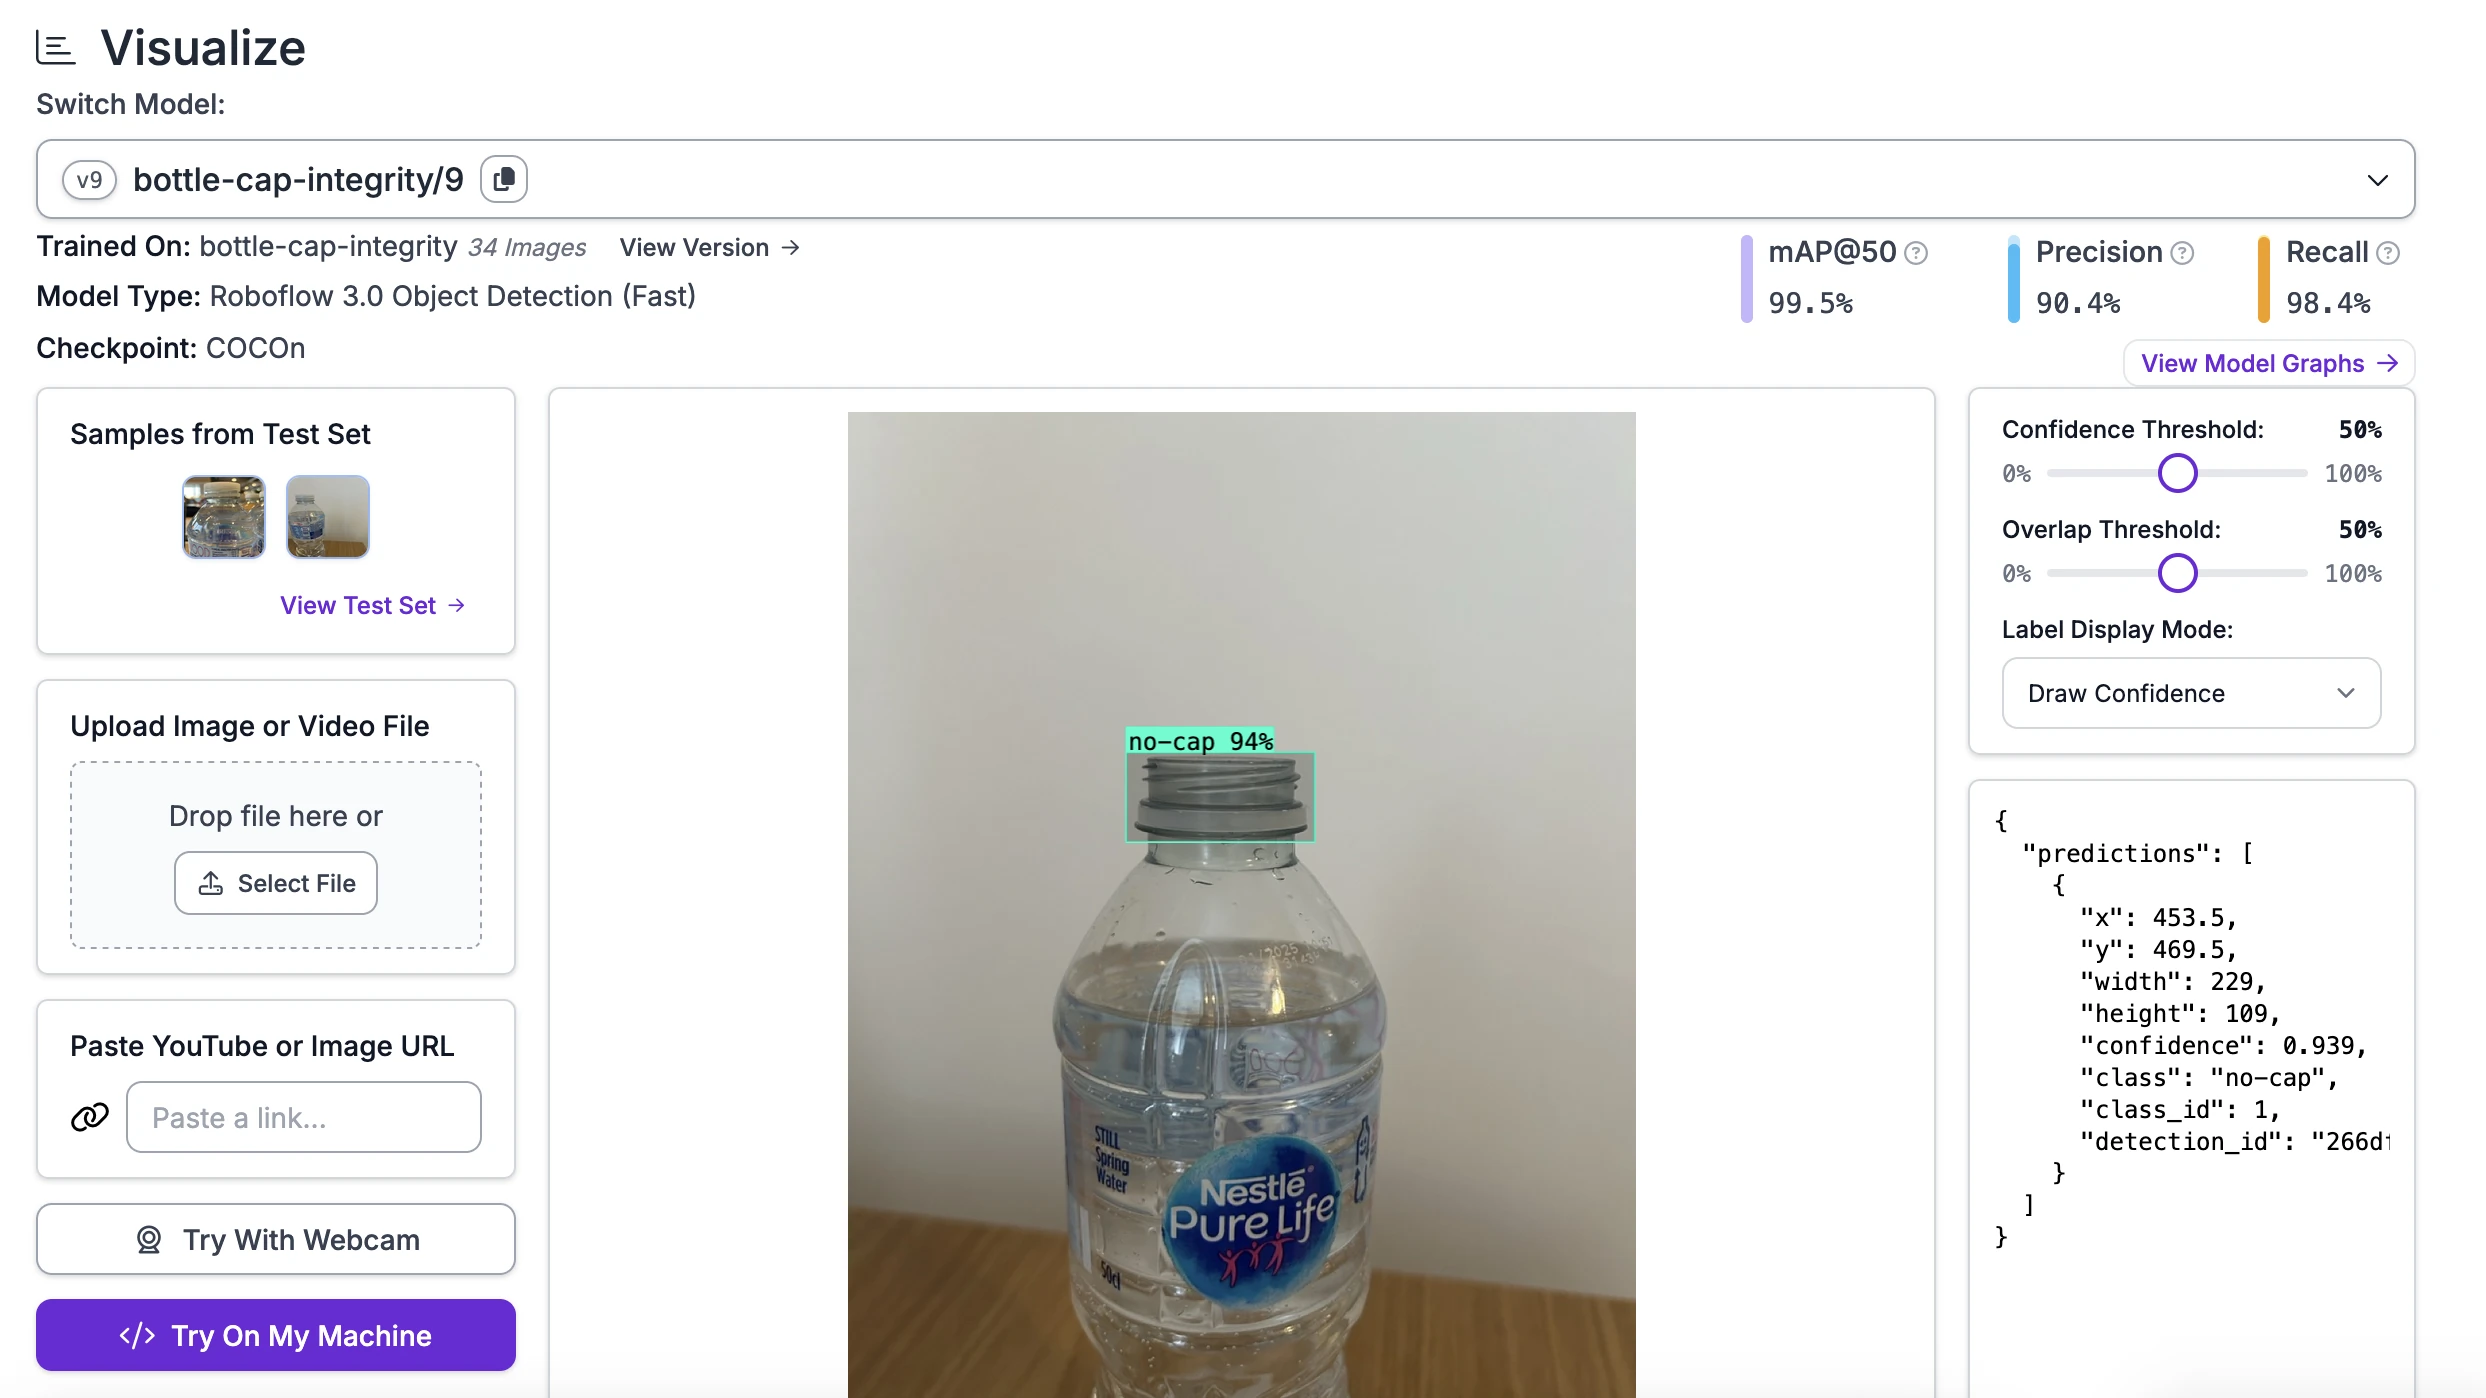
You can test your model on an image from the Test page. This is a good way to run quick checks to see how your model performs before you build your application logic in Workflows.

The Test feature works for object detection, segmentation, classification, and keypoint models. Test is not supported for multimodal projects.

To test a model, click "Test" on the right sidebar. The Test page will then open:

The Test page will show several images from your test set from which you can select to run on your model. You can also upload your own images and videos, or try with your webcam.

To find deployment instructions for your model, click Try on My Machine. You can also deploy your model on Roboflow Workflows.

HTTP API

Get Training Results

Retrieve the training results for a dataset version. For NAS (Neural Architecture Search) training runs, this returns a bundled view including all child models, their metrics, hardware-specific recommendations, and mining frontier data. For standard fine-tune runs, it returns a minimal summary.

This endpoint consolidates multiple reads into a single call, so you don't need to fetch model data separately.

Endpoint

Authentication: Requires an API key with version.read scope.

Request

Response (NAS Training)

Response (Fine-Tune Training)

For non-NAS training runs, the response is a minimal bundle:

Response Fields

Field
Type
Description

trainingId

string

Composite ID in workspace/project/versionId format

status

string

Training status (e.g. finished, running, failed)

jobType

string

nas for NAS runs, fine-tune for standard training

modelType

string

The model architecture used for training

modelGroup

string | null

Group identifier for NAS child models. null for non-NAS runs

modelCount

number

Number of models produced by the training run

recommendedByHardware

object

Map of hardware target to the recommended model ID for that target. NAS only

mining

object

Mining frontier and snapshot data, if available. NAS only

models

array

Per-model summaries (see below)

Model summary fields:

Field
Type
Description

modelId

string

Public model identifier (URL slug). This is the same value used in POST /:workspace/models/:modelId/favorite

modelType

string

Model architecture variant

status

string

Training status for this model

nasFamily

string

child or baseline. NAS only

metrics

object | null

Training metrics (mAP, latency, etc.), scaled to percentages. null if training is still in progress

recommended

boolean

Present and true if this model is a recommended pick

Errors

Status
Description

404

Version not found

401

Invalid or missing API key

403

API key lacks version.read scope

Last updated

Was this helpful?